Let’s dive into February 2025 with the top ten charts to watch, each one offering a glimpse into the market’s heartbeat. This selection highlights what’s shaping the current narrative—so, are you ready to see what’s making waves?
First up: the semiconductor ETF, SMH.
Semiconductors like Nvidia and AMD have hit a few speed bumps lately, thanks to news from China’s Deep Seq AI. Did it derail them? Not quite. Despite a dramatic gap lower, SMH found solid support. Now, we’re watching closely: will it climb above 260 or slide below 235? The answer could set the tone for February.
Source: StockCharts.com
Costco’s story is all about momentum.
Blasting past the symbolic $1,000 mark, Costco is painting a picture of incredible strength. But can it keep up this record-breaking pace? February could reveal if this consumer powerhouse has more gas in the tank—or if it’s time to ease off the throttle.
Then there’s Alphabet, which feels like a puzzle.
Earnings disappointed, causing a slight gap down, yet the stock clings above its 50-day moving average. Is this just a hiccup on its upward path or an early warning of turbulence ahead? Alphabet’s next move could speak volumes about broader market sentiment.
Source: StockCharts.com
Travel giant Marriott keeps climbing.
With a smooth ascent past December’s highs, it’s feeding optimism in travel stocks. But how far can this momentum carry it? Marriott’s steady rise reminds us of the strength in consumer discretionary names, but we’ll see how long it can hold its ground.
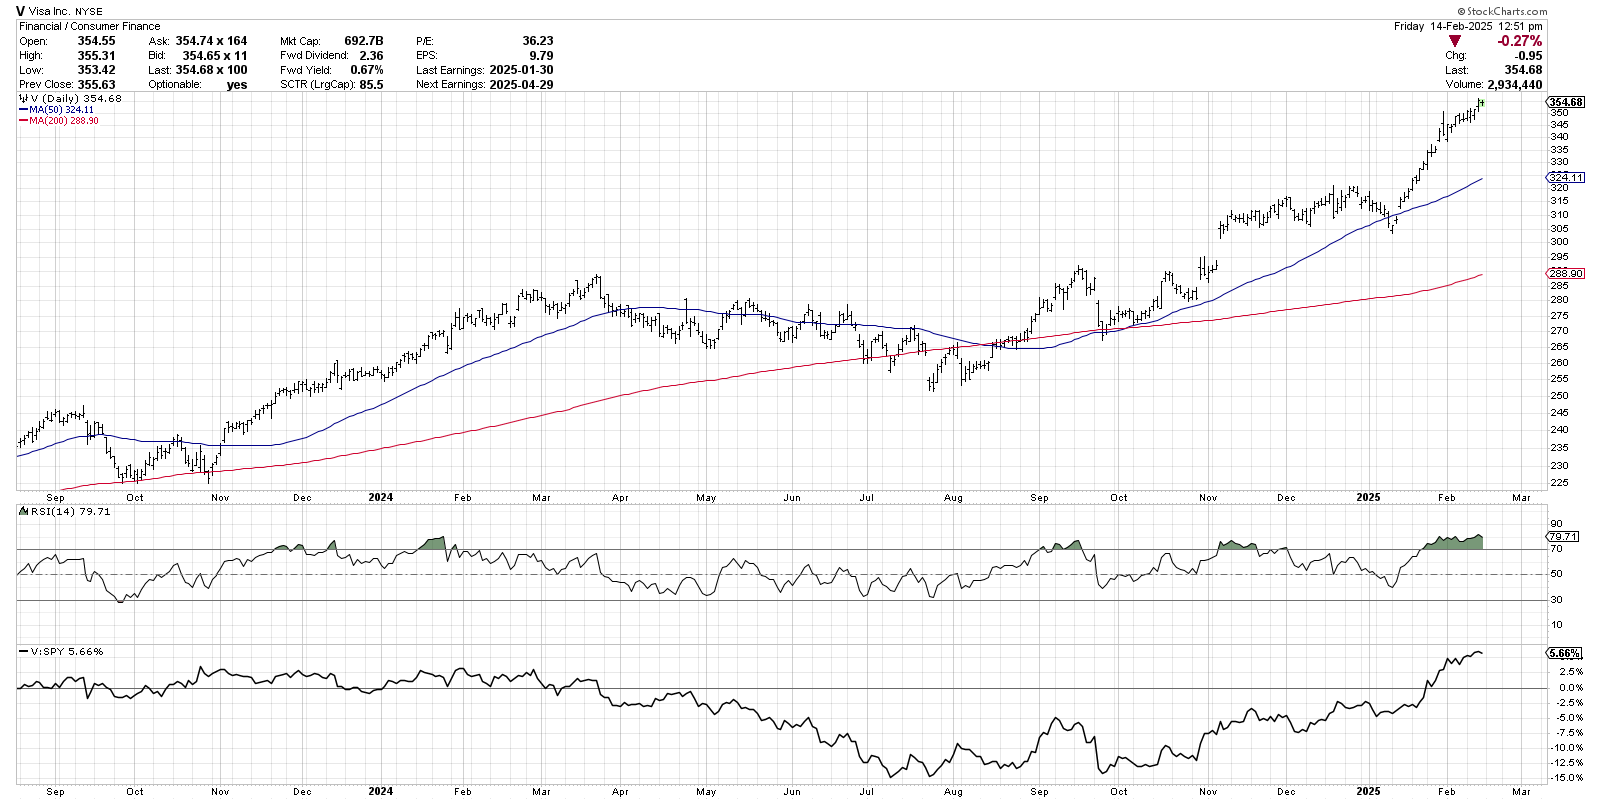
Visa’s chart is textbook strength.
A classic cup-and-handle pattern and consistent higher highs make it a standout. Will resistance finally slow it down, or will it continue its strong upward stride? Visa’s steady march has our full attention.
Source: StockCharts.com
So, there you have it—the first five of ten compelling stories playing out on the charts. Each one shines a light on a different part of the market, and together, they paint a vivid picture of what February might hold.
Check out the rest of our Top Ten Charts to Watch over at our YouTube channel. And did I miss any that you would include on your own list of top ten charts? Don’t forget to drop a comment and let me know!
Thanks for reading, and don’t forget to check out CHART THIS with Dave Keller, airing weekdays at 5 PM Eastern, for daily market close review. If you’re ready to take your market knowledge to the next level, check out our Market Misbehavior Premium Membership for exclusive access to in-depth analysis, actionable insights, and strategies designed to help you navigate any market condition with confidence. Don’t miss out—let’s keep building your investing edge together. Join Now!
RR#6,
Dave
Disclaimer: This blog is for educational purposes only and should not be construed as financial advice. The ideas and strategies should never be used without first assessing your own personal and financial situation, or without consulting a financial professional.
The author does not have a position in mentioned securities at the time of publication. Any opinions expressed herein are solely those of the author, and do not in any way represent the views or opinions of any other person or entity.


