
Breakout Update- China, Small Caps
Back on February 17th, I wrote about the availability heuristic and breakouts that were happening in a number of index charts. As a review, if all you see are breakouts, I find it helpful to identify charts that look different. This can help you see some potential future opportunities if those markets do eventually follow suit. Also, these "non breakout" charts can serve as confirmation down the road- if they do finally break out, this tells you it is more of a global phenomenon as opposed to a limited one.
Breakout Update
Two markets we looked at were the S&P 600 Small Cap index and the iShares MSCI China ETF. Let's review both and see what has happened in the last couple months.
Here is the MCHI index on 2/17/07:
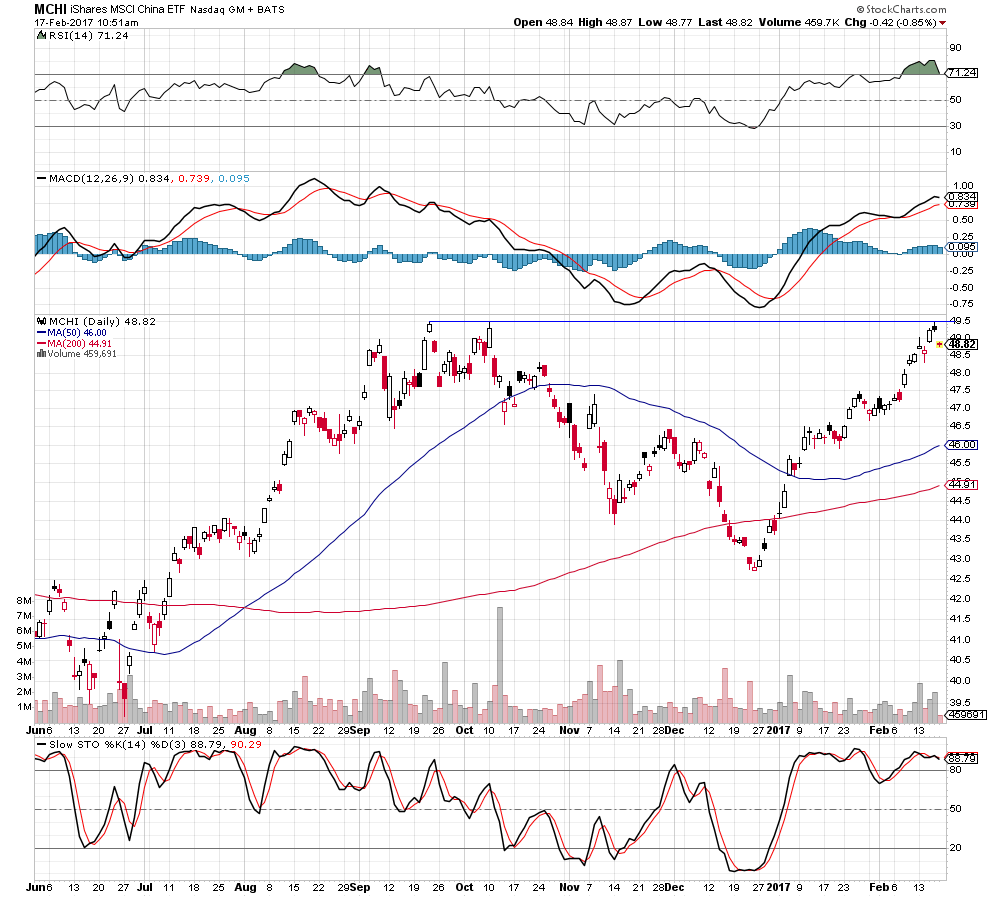
MCHI index, daily data Source: stockcharts.com
...and here is the updated chart as of 5/9/17:

MCHI index, daily data Source: stockcharts.com
So the ETF pulled back a couple points after hitting the resistance we discussed. Then soon after, broke to new highs. MCHI then found support at that same level (49.50, also the 50-day moving average) and continued its stepwise motion higher. Count that as a positive breakout.
Now, here is the SML index on 2/17/07:

SML index, daily data Source: stockcharts.com
...and here is the updated chart as of 5/9/17:

SML index, daily data Source: stockcharts.com
In this case, we still have not seen a convincing breakout. The level we identified in February (~860) held once again in April, and the SML has essentially been rangebound for five months and counting.
So What Now?
Out of the two "haven't broken out yet" charts that we identified during our discussion of the availability heuristic, one has broken out, one is still unconfirmed. Worth watching the SML chart to see if we finally get an upside resolution!
Disclaimer: This blog is for educational purposes only, and should not be construed as financial advice. Please see the Disclaimer page for full details.