
Real Estate ETFs Oversold
"Those who do not study the past will repeat its errors. Those who do study it, will find other ways to err!" -Bob Farrell
As part of my normal routine of screening for ETFs making meaningful moves, I look for those with an RSI less than 40. If you're familiar with Connie Brown's classic book on oscillators, you'll remember that in a bullish phase, you can bump the overbought/oversold levels higher as the RSI will rarely get all the way back down to 30. Here's an example with the SOX index:
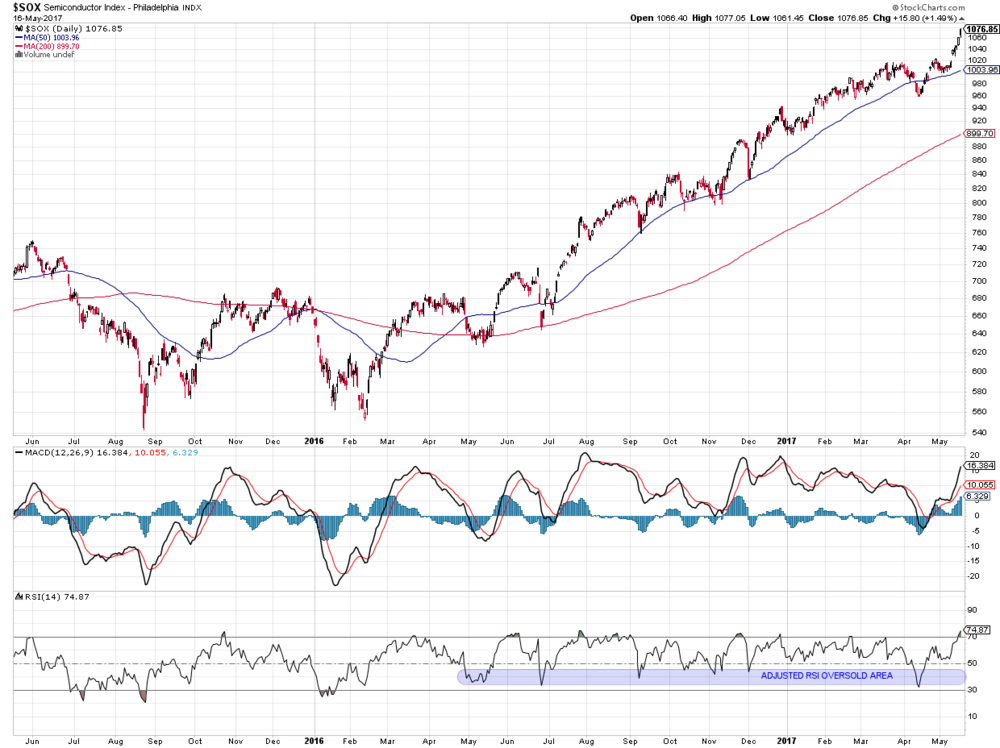
Philadelphia Semiconductor Index, daily data Source: stockcharts.com
I noticed in today's oversold screen that most of the results are real estate ETFs. The IYR is a good example as the others look quite similar.
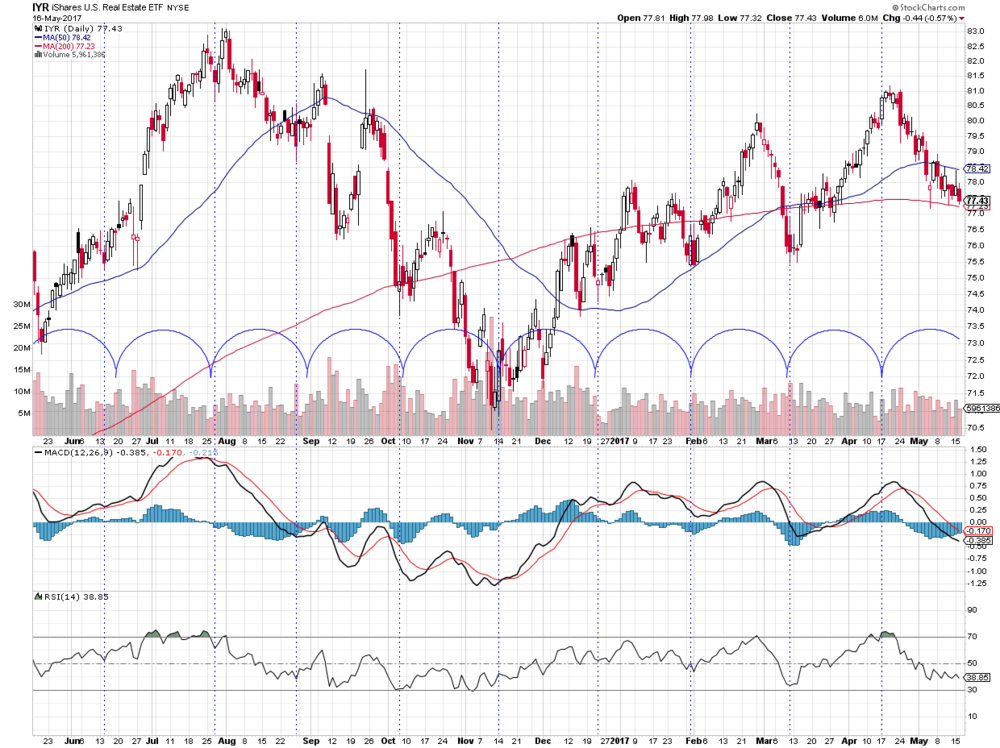
iShares US Real Estate ETF, daily data Source: stockcharts.com
You'll notice some blue lines on the chart that highlight the cyclical pattern of the price. Every 28 bars or so, the IYR has seen a short-term bottom (except for the most recent cycle point, which was a top). That cycle would be due in the next week or so.
What does this mean? It means real estate is nearing the point where it has tended to bounce higher.
What does this *not* mean? That real estate will definitely go up!
What happens if it continues lower? Certainly a possibility and that would tell me that real estate is in a bearish phase instead of the beginning of a bullish one.
As much as indicators, oscillators, cycles, etc. can be interesting, the most important thing to analyze to get a read on the price is the price itself! Where an indicator like RSI can be helpful is to get charts like this on your radar, so you can follow subsequent price action.
RR#6,
Dave
Disclaimer: This blog is for educational purposes only, and should not be construed as financial advice. Please see the Disclaimer page for full details.